This one line of Javascript made FT.com 10 times slower
A journey into a performance degradation…
View human-generated summary 🧬
- pay attention to your errors and metrics
- don't block the event loop
- JavaScript is annoying sometimes
The Discovery
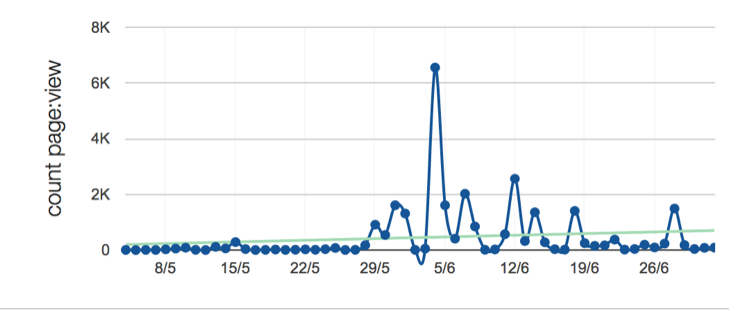
It started off with an alert, telling us that the error rate for the Front Page application is above the 4% threshold.
This had a real impact on our users, with thousands of error pages being shown (somewhat offset by caching in our CDN).
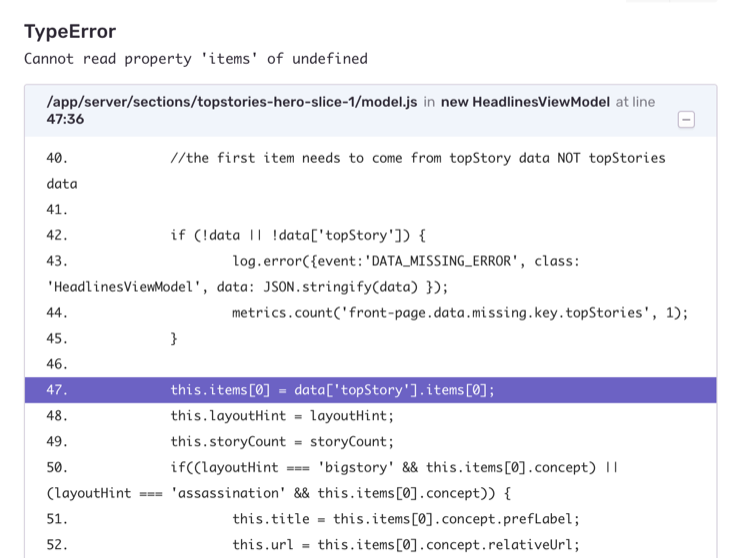
Looking at the error logs for the app showed that the application didn’t have any data for the top stories.
The Diagnosis
The front page works by polling a GraphQL api on an interval to get the data, storing that data in memory and rendering it on request. In theory, it is supposed to keep the stale data if a request fails. Digging further into the logs, we saw that the requests to the GraphQL api were failing, but with an error rather than a timeout — or at least a different type of timeout.
FetchError: response timeout at https://….&source=next-front-page over limit: 5000
Curiously, the response times for the API seemed well below the 5 second timeout that the front page was setting. This led us to believe that the issue was somewhere in the connection between the front page and the app. We tried a few things — using a keepAlive connection between the two, scattering the requests so they won’t all happen at the same time. None of these seemed to make any impact.
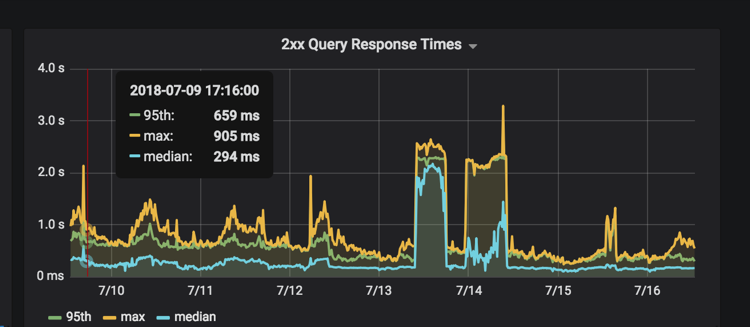
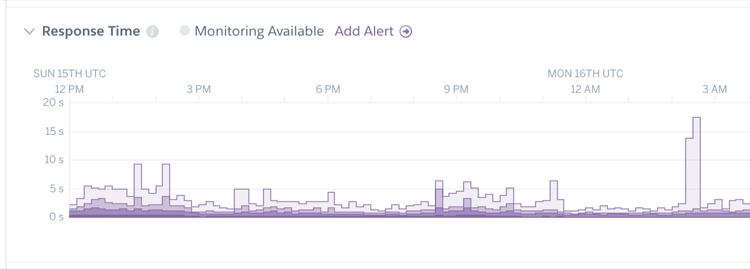
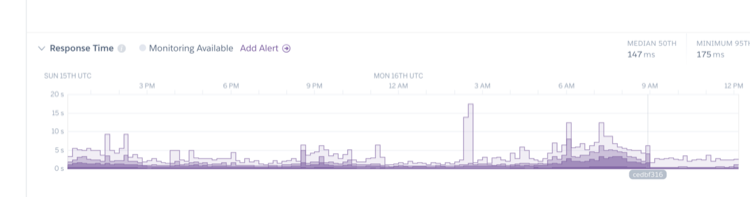
What added to the mystery was the response times shown on Heroku. The 95th percentile was around 2–3 seconds, with a max sometimes reaching 10–15 seconds. Since the front page is heavily cached by Fastly, including stale-while-revalidate headers, this likely wouldn’t have been noticed by many users. But it was strange because the front page really shouldn’t have been doing a lot of work to render a page. All the data was in kept in memory.
So we then decided to do some profiling against a locally running copy of the app. We would replicate some load by using Apache Bench to make 1000 requests, with 10 requests a second.
ab -n 1000 -c 10 http://local.ft.com:3002/
Using node-clinic and nsolid, we could gain some insights into what’s going on with the memory, CPU and application code. Running this confirmed that we could reproduce the issue locally. The front page took between 200–300s to complete the test, with over 800 requests unsuccessful. In comparison, running the same test on the article page took around 50s.
Time taken for tests: 305.629 seconds
Complete requests: 1000
Failed requests: 876
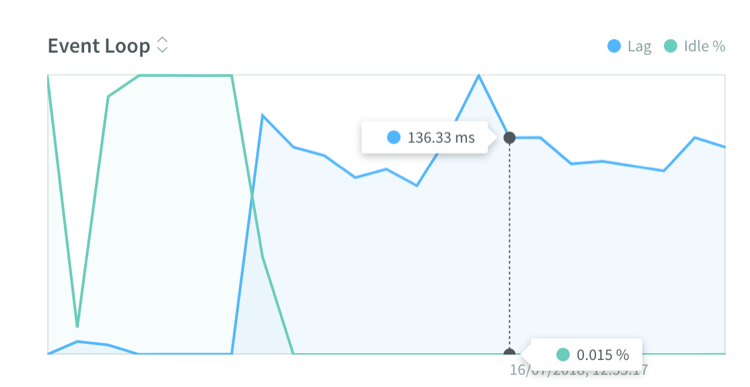
And lo and behold, the graphs from n-solid showed us that the event loop had a lag of over 100ms.
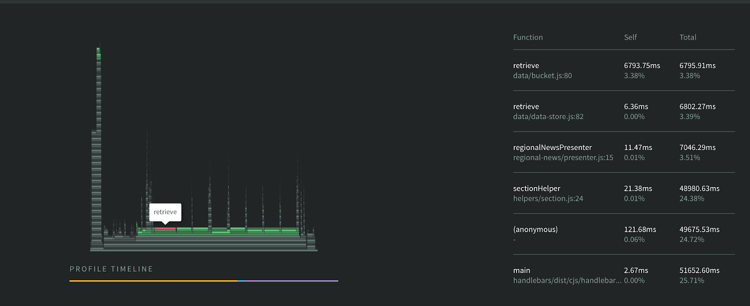
Using n-solid’s CPU profiler allowed us to pinpoint the exact line of code blocking the event loop. In the flame chart below, the wide lines indicate operations that are taking a long time. This showed us the offending code was in the retrieve function.
The Fix
And the culprit was….
return JSON.parse(JSON.stringify(this._data));
For every request, we were using JSON.parse/stringify to create a deep clone of the data. This method isn’t bad in itself — and is probably one of the faster ways of deep cloning. But they are synchronous methods, and so will block the event loop whilst being executed.
In our case, this was being called several times on each render of a page (for every section being rendered), with a large amount of data (the data required for the entire page on each execution), and we get several concurrent requests. Since Javascript is single-threaded this would have a knock-on effect on everything else the app was trying to do.
The reason we were deep cloning the data was because there were some things that were mutating the object, based on some information from the request (for example, if a particular feature toggle was on).
To fix this problem - and alleviate the need to clone everything - we applied a deep freeze to the object on retrieval, and then where it was being mutated we could clone the specific bits that needed to be mutated. This still performs a synchronous clone — but only on a much smaller subset of data.
The Results
With the fix in place, we re-ran the load test and it completed in a fraction of the time, with 0 errors.
Time taken for tests: 37.476 seconds
Complete requests: 1000
Failed requests: 0
Once we released the fix to production, we saw an instant decrease in response time and errors (🤞🏼), and hopefully some happy users!
The Future
- It would be interesting to run this analysis on some of our other apps and see where we can further optimise and/or reduce dyno sizes.
- Can we get more visibility of our event loop?
- Our front page should have stale-on-error — so why were still thousands of error pages seen? Is that number good or bad?